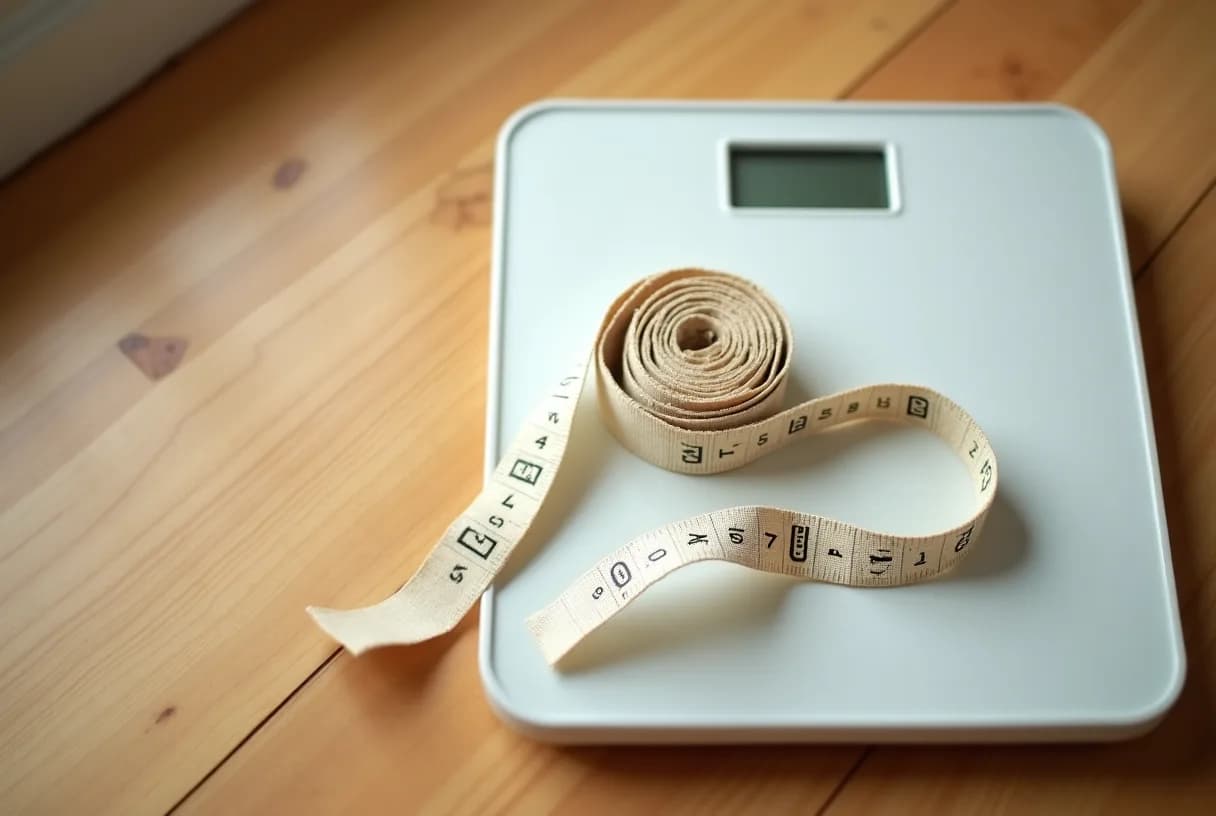
You came here for a number, so here it is, from the most recent nationally representative measured data the United States has. In the National Health and Nutrition Examination Survey (NHANES) conducted between August 2021 and August 2023, women age 20 and older averaged 171.8 pounds and 63.5 inches tall (about 5 ft 3½ in). Mean BMI: 30.0. Mean waist: 97.9 cm (38.5 in). The median — the woman exactly in the middle — weighed 162.0 pounds.
Now the part almost no one tells you, and the reason this page exists. That average BMI of 30.0 sits precisely on the line clinicians call obesity. In the same survey period, 40.3% of US adults had obesity and another 31.7% were overweight — 72.0% in total, age-adjusted. So the "average" describes a population in which roughly seven in ten adults already sit above the BMI range labelled normal. An average is not a target. Matching it does not make you healthy. Missing it — in either direction — does not make you unhealthy. If you use the national mean as a goalpost, you have chosen a goalpost that public-health researchers spend their careers trying to move.
The data you searched for
These are measured values (people stood on a scale in a mobile examination centre), not self-reported, and pregnant women are excluded. One caution before you read down the age column: this is a snapshot of different women at different ages, not a film of one woman ageing. Mean weight peaks in the 50s and then falls — and that decline is not a triumph of willpower. It reflects the loss of muscle and bone that comes with age, differences between generations, and the fact that heavier adults are less likely to reach their 80s.
| Age | Mean weight | Median weight | Mean height | Mean BMI | Mean waist |
|---|---|---|---|---|---|
| 20–29 | 164.9 lb | 151.9 lb | 64.4 in | 28.0 | 35.6 in (90.5 cm) |
| 30–39 | 178.3 lb | 165.3 lb | 64.0 in | 30.5 | 38.5 in (97.8 cm) |
| 40–49 | 177.3 lb | 164.8 lb | 63.7 in | 30.7 | 38.7 in (98.2 cm) |
| 50–59 | 180.0 lb | 173.0 lb | 63.5 in | 31.4 | 40.0 in (101.5 cm) |
| 60–69 | 171.0 lb | 163.8 lb | 63.2 in | 30.1 | 39.5 in (100.3 cm) |
| 70–79 | 162.8 lb | 158.0 lb | 62.3 in | 29.5 | 39.2 in (99.6 cm) |
| 80+ | 149.7 lb | 144.8 lb | 61.7 in | 27.7 | 38.0 in (96.5 cm) |
| All 20+ | 171.8 lb | 162.0 lb | 63.5 in | 30.0 | 38.5 in (97.9 cm) |
The spread matters more than the middle. Among women 20 and older, the 10th percentile weighs 120.6 lb and the 90th weighs 236.3 lb. Nearly 116 pounds separate two women who are both, statistically, entirely ordinary.
Why "average" got detached from "healthy"
Two things happened. First, Americans got heavier: adult obesity prevalence has roughly tripled since the early 1960s, when the federal survey programme first measured it, and it now stands at 40.3%. Second, the word "average" kept its comforting connotation while the underlying number drifted somewhere clinicians would not choose.
So the sentence you actually need is this: the average is where people are, not where health is. A table of "average weight by height and age" answers a curiosity question. It cannot tell you whether your blood pressure is fine, whether your liver is storing fat, whether you have enough muscle to get off the floor unassisted at 75. Those are the questions your body is actually asking.
What the scale genuinely cannot see
A bathroom scale reports one number for four very different tissues: fat, muscle, bone and water. Two women at 165 pounds and 5 ft 4 in can have wildly different amounts of each, and their risk profiles are not remotely the same. BMI inherits the same blindness — it is a ratio of weight to height and knows nothing about composition or fat distribution. It is a reasonable screening tool across a population and a crude one for an individual; we unpack its history and its failure modes in BMI for women. (If you want to see where you land anyway, our BMI calculator will tell you — and will also tell you what the number does and doesn't mean.)
What matters more than how much fat you carry is where it sits. Subcutaneous fat — under the skin, on hips and thighs — is metabolically fairly quiet. Visceral fat, packed around the liver, pancreas and intestines, is not: it is more lipolytically active, drains directly into the portal circulation, and tracks with insulin resistance, higher triglycerides, lower HDL cholesterol and raised blood pressure. That is why a woman with a modest BMI and a thick middle can carry higher cardiometabolic risk than a heavier woman who stores weight peripherally.
The midlife problem nobody puts in the average-weight article
Here is the finding that should reframe this entire topic for anyone over 40. During the menopause transition, body composition changes in a way that body weight hides.
In the Study of Women's Health Across the Nation (SWAN), which followed women through the transition with DXA scanning, the rate of fat gain roughly doubled — from about 1% a year beforehand to about 1.7% a year — starting around two years before the final menstrual period and continuing for roughly two years afterwards. Lean mass, which had been slowly rising, began to fall across the same window. And here is the sting: body weight itself rose in a straight line through all of it, with no acceleration to mark the change. The scale registered nothing unusual while the tissue underneath it was being swapped.
Where the fat lands has been tracked too. In a longitudinal study using CT imaging, intra-abdominal (visceral) fat climbed across the transition — increasing in the years before the final period and then holding at the new, higher level into early postmenopause — alongside a fall in resting energy expenditure. That is the classic redistribution from hips to abdomen, and it does not politely wait for your last period.
Translate that into your bathroom. Your weight can look flat, or creep up in the same unremarkable way it always did, while you trade muscle for abdominal fat. On the measures that matter you are worse off, and the scale has told you nothing. It is also why waistbands stop fitting in a year the scale calls "stable" — the single most common and most dismissed complaint in perimenopause. We cover the mechanism in menopause belly fat and the wider picture in menopause weight gain.
The lean-mass side of this is the underrated half. Muscle loss in midlife (sarcopenia) reduces strength, reduces glucose disposal, and raises fracture risk when it travels alongside bone loss. It is also the one variable on this page you can most directly change — resistance training and enough protein are the evidence-backed levers, not a smaller number on the scale. See strength training for women.
What to measure instead
1. Waist circumference. Measure with a tape at the top of the hip bone, level all the way round, after breathing out normally — not sucked in. For women, a waist above 35 inches (88 cm) is the long-standing US threshold for increased cardiometabolic risk. Sit with the implication for a second: the average American woman's waist, at 38.5 inches, is already past it. That is a statement about the population, not an indictment of anyone in it.
2. Waist-to-height ratio. This is the most useful thing on this page and it takes ten seconds. Divide your waist by your height in the same units. The rule of thumb: keep your waist under half your height. The UK's national guideline body (NICE) now recommends waist-to-height ratio alongside BMI for adults with a BMI under 35, precisely because it captures central fat that BMI misses, and it works across heights and body sizes without a separate chart.
| Waist ÷ height | Interpretation | Example (5 ft 4 in / 64 in) |
|---|---|---|
| Below 0.4 | May indicate underweight — worth a check if unintentional | Waist under 25.6 in |
| 0.4 to 0.49 | Healthy central-fat range | Waist 25.6–31.4 in |
| 0.5 to 0.59 | Increased central fat; raised cardiometabolic risk | Waist 32.0–37.8 in |
| 0.6 or above | High central fat; discuss with a clinician | Waist 38.4 in or more |
3. Blood markers, not body markers. Blood pressure, fasting glucose or HbA1c, and a lipid panel tell you more about your ten-year risk than any tape measure. A woman with a BMI of 31 and normal blood pressure, normal glucose and a good lipid panel is in a different situation from a woman with the same BMI and three abnormal results — and no weight chart can distinguish them.
4. Function. Can you carry the shopping up a flight of stairs without stopping? Get up from the floor without using your hands? In the PURE study, which followed nearly 140,000 adults across 17 countries, grip strength predicted death and cardiovascular events more strongly than systolic blood pressure did. It costs nothing to test, and unlike the national mean, it answers to training.
5. Trajectory, not absolute value. A stable weight with a growing waist is a real signal. A weight that changes by 5 pounds across a month is mostly water, glycogen and the timing of your last meal.
Notice what is not on this list: a target weight. We do not publish one, and you should be sceptical of any page that hands you a "goal weight for your height" as though it were a clinical finding. Our ideal weight calculator exists because people search for it — it shows what the old actuarial formulas (Devine, Hamwi, Robinson) produce, and it says plainly that those formulas were built for drug dosing and mid-20th-century insurance tables, not for telling you what your body should be.
When to see a doctor
Talk to a clinician — soon, not at your next routine appointment — if any of the following applies:
- Unintentional weight loss of more than about 5% of your body weight (roughly 8 lb if you weigh 165 lb) over 6–12 months without trying. This warrants investigation regardless of your starting weight; see unexplained weight changes for the reverse situation.
- Rapid or unexplained weight gain, especially with swelling in the legs, breathlessness, or a change in how far you can walk — that pattern can mean fluid retention rather than fat gain.
- A waist that keeps growing while your weight is stable, particularly alongside new fatigue, thirst, or a family history of type 2 diabetes.
- Symptoms suggesting a thyroid problem — cold intolerance, hair thinning, constipation, unusual fatigue. Thyroid disease is far commoner in women and is easily tested; see thyroid or menopause.
- You are restricting food, purging, over-exercising, or cannot stop thinking about your weight. Eating disorders occur at every body size, are frequently missed in women over 40, and are treatable. This is a medical issue, not a discipline issue — please raise it.
- You want to discuss weight management and would like it handled as a clinical conversation, with your blood pressure, glucose, lipids and medications on the table, rather than a chart on a wall.
The bottom line
The average American woman weighs 171.8 pounds and stands 63.5 inches tall. Now that you know it, notice how little it does for you. It cannot tell you whether you are healthy; it can only tell you whether you are typical — and in a country where about seven in ten adults sit above the "normal" BMI range, typical is not a standard worth chasing.
The measurements that repay your attention are the ones that move when you do something: your waist relative to your height, your blood pressure, your glucose, how much muscle you have and whether you are keeping it. Those respond to sleep, to protein, to lifting things, to treating a thyroid problem, to managing blood pressure. The national mean responds to nothing you will ever do. Measure the things you can move.
More from weight & metabolism: what really happens to metabolism with age, and our full set of health tools.